Enable Monitoring
LLMOS Monitoring makes it easy to track cluster and GPU metrics with ready-to-use Grafana dashboards, Prometheus rules, and more, using the Prometheus Operator.
This page describes how to enable monitoring and alerting within a cluster using the built-in LLMOS Monitoring addon.
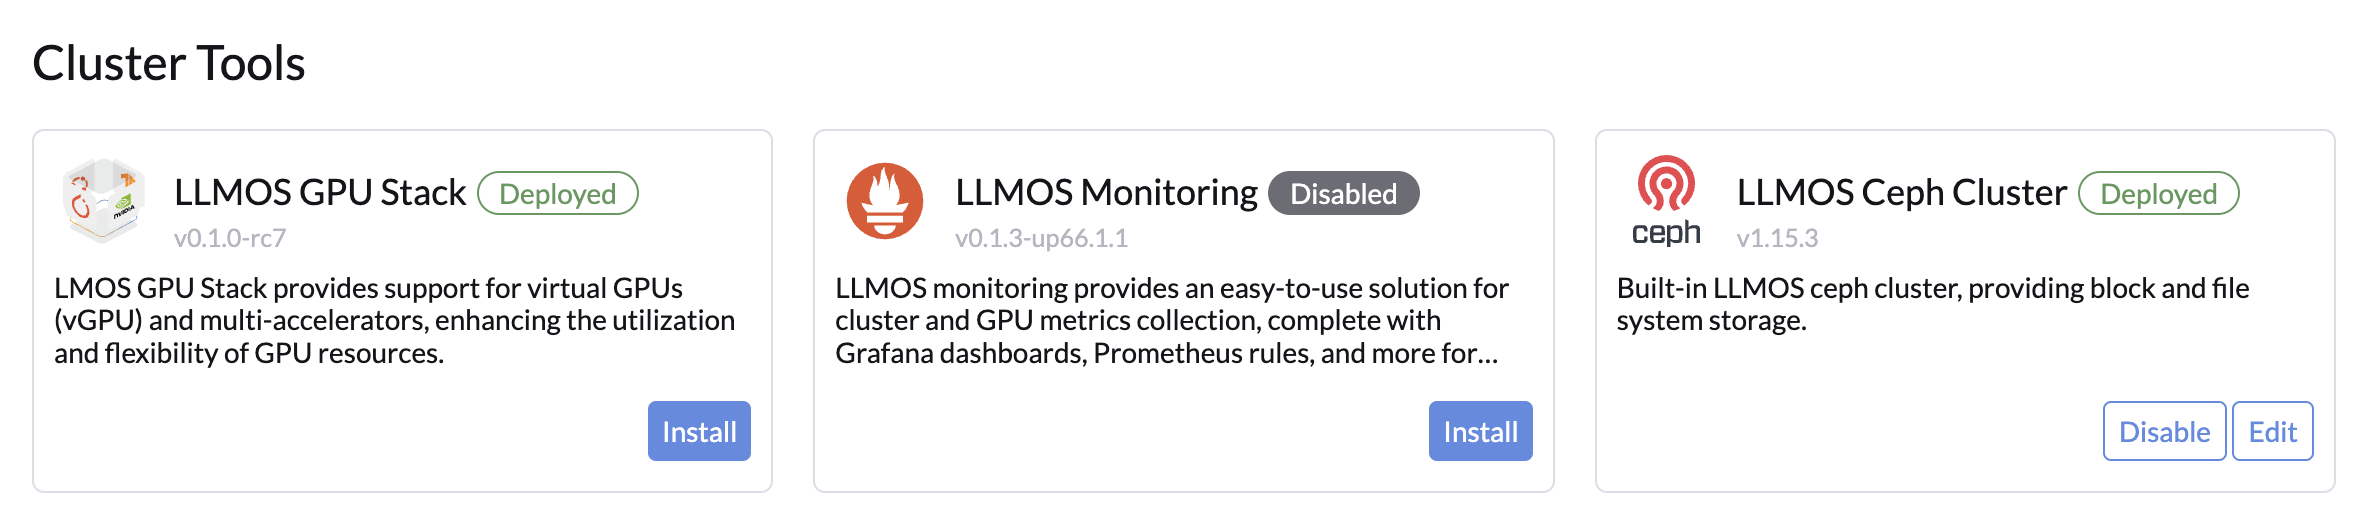
Enabling Monitoring
To enable monitoring, go to the Cluster Tools page as an admin user. Click Install, and you'll be directed to the Monitoring configuration page.
Requirements
- If your cluster is a multi-node cluster and requires persistent storage for the monitoring, enable the Ceph System Storage first before setting up monitoring.
- Ensure your cluster meets the resource requirements:
- CPU: At least
1250m - Memory: At least
1210Mi - Storage: At least
50Gi - For details, see Resource Limits and Requests.
- CPU: At least
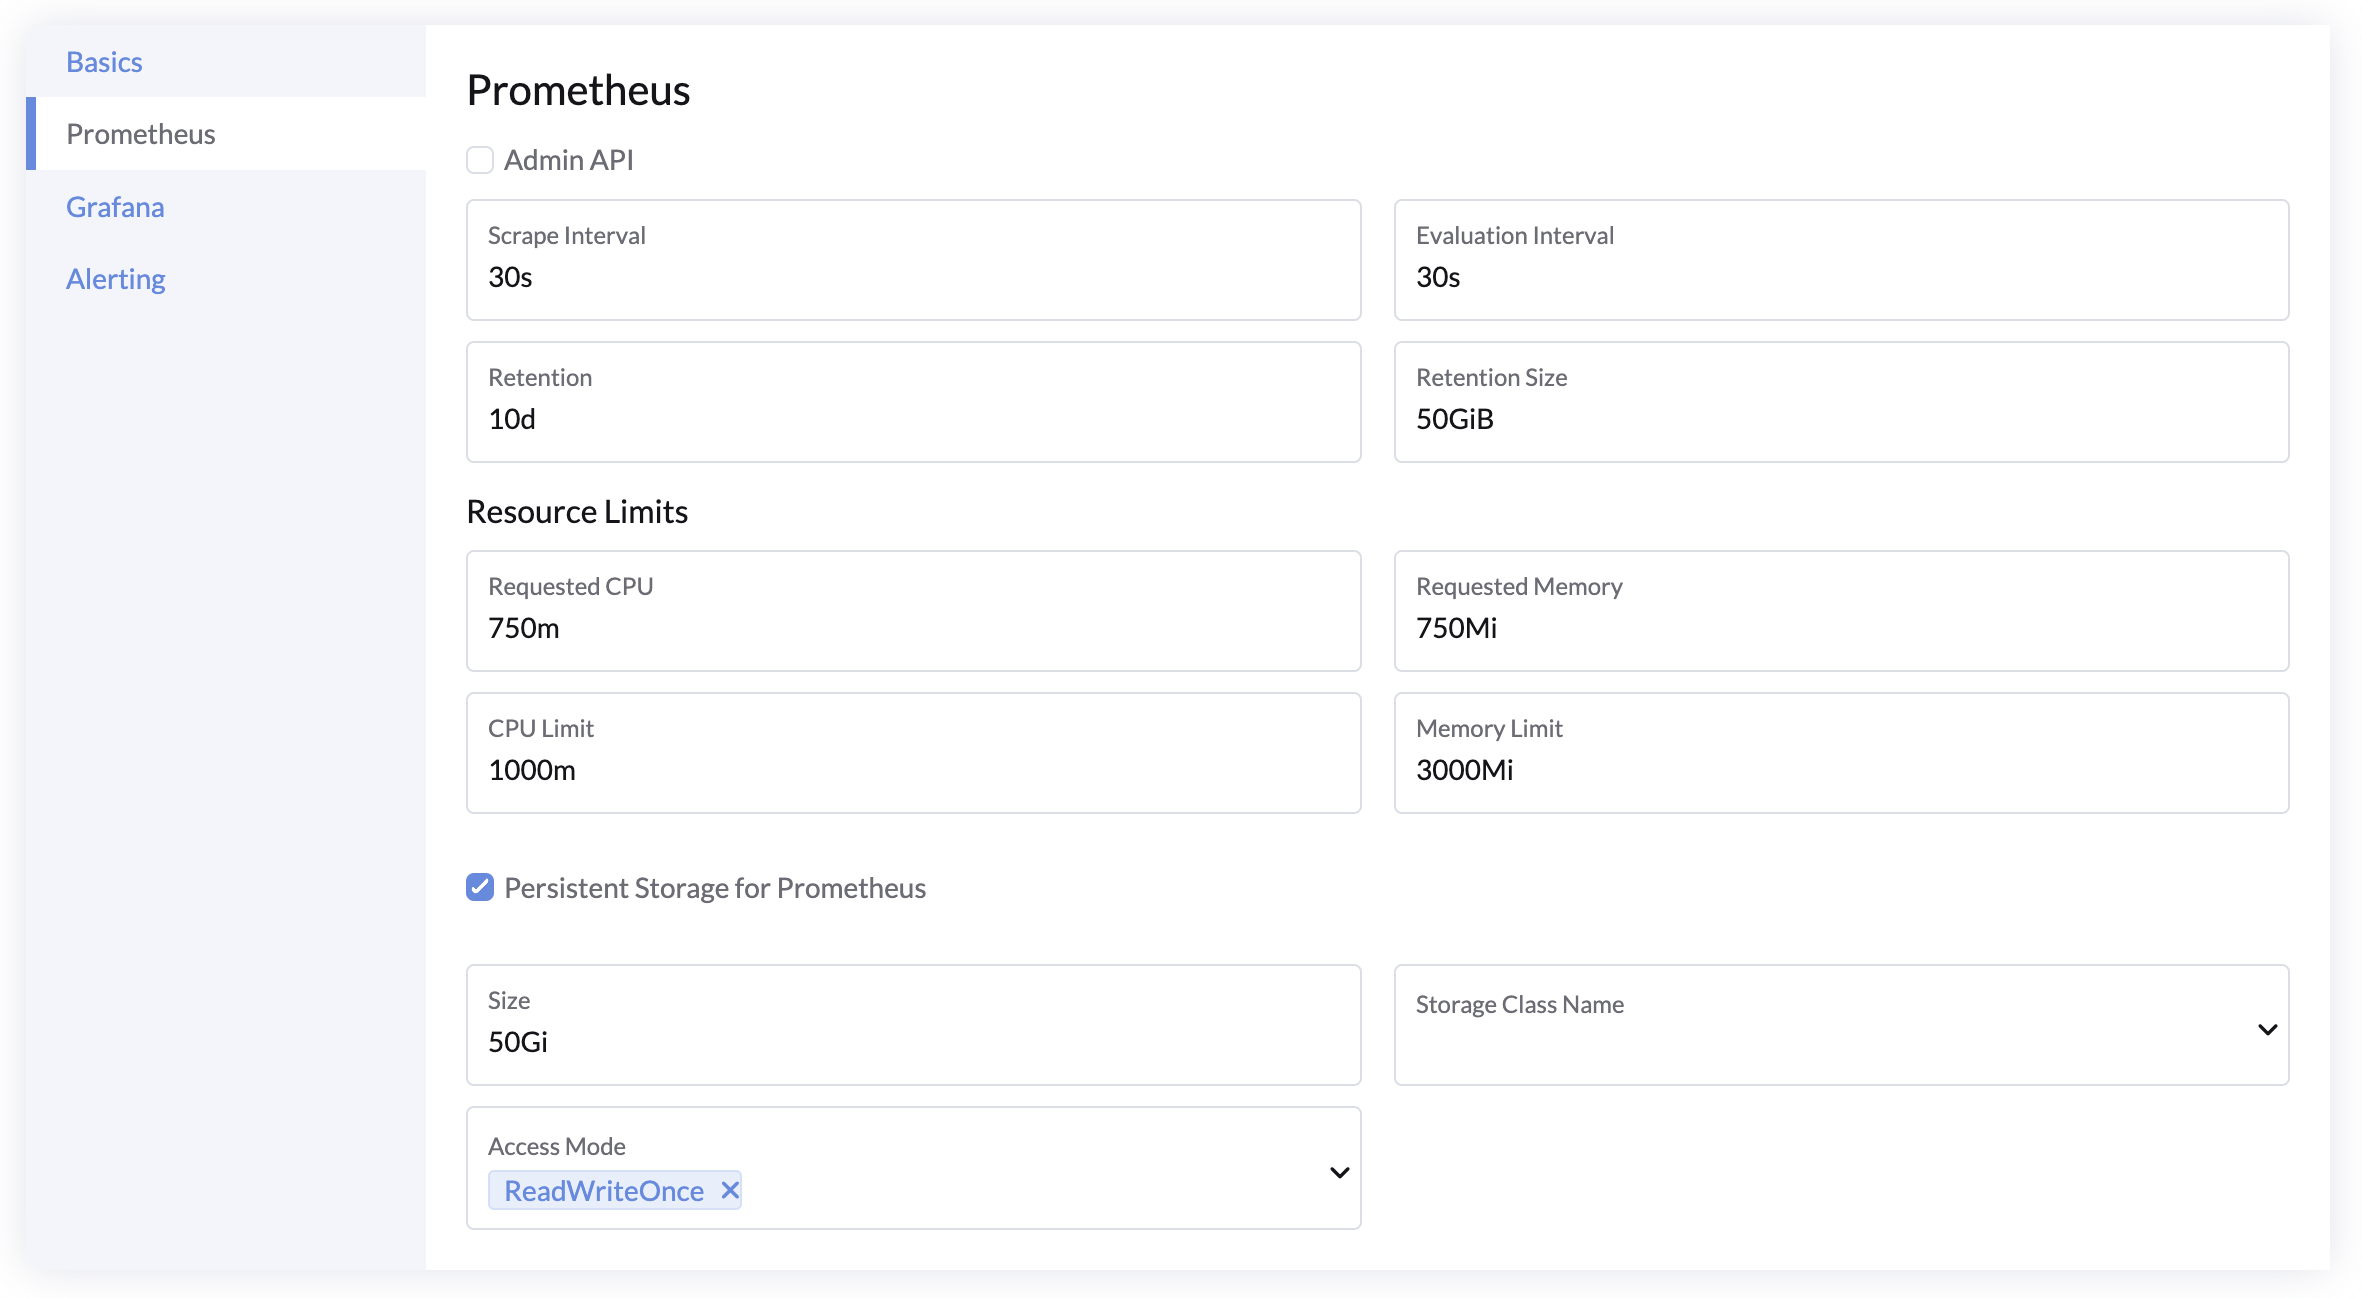
Prometheus Settings
- Admin API: Enable the Prometheus Admin API for advanced features like snapshots and deleting time series. Disabled by default.
- Scrape Interval: How often Prometheus collects metrics. Default:
30s. - Evaluation Interval: How often Prometheus checks alerting rules. Default:
30s. - Retention: How long metrics are kept. Default:
10d. - Retention Size: Maximum size for stored metrics. Default:
50GiB. - Resources: Set resource requests and limits for Prometheus pods.
- Persistent Storage: To retain data across deployments and upgrades, configure persistent storage for Prometheus
- At least
50Giis recommended.
- At least
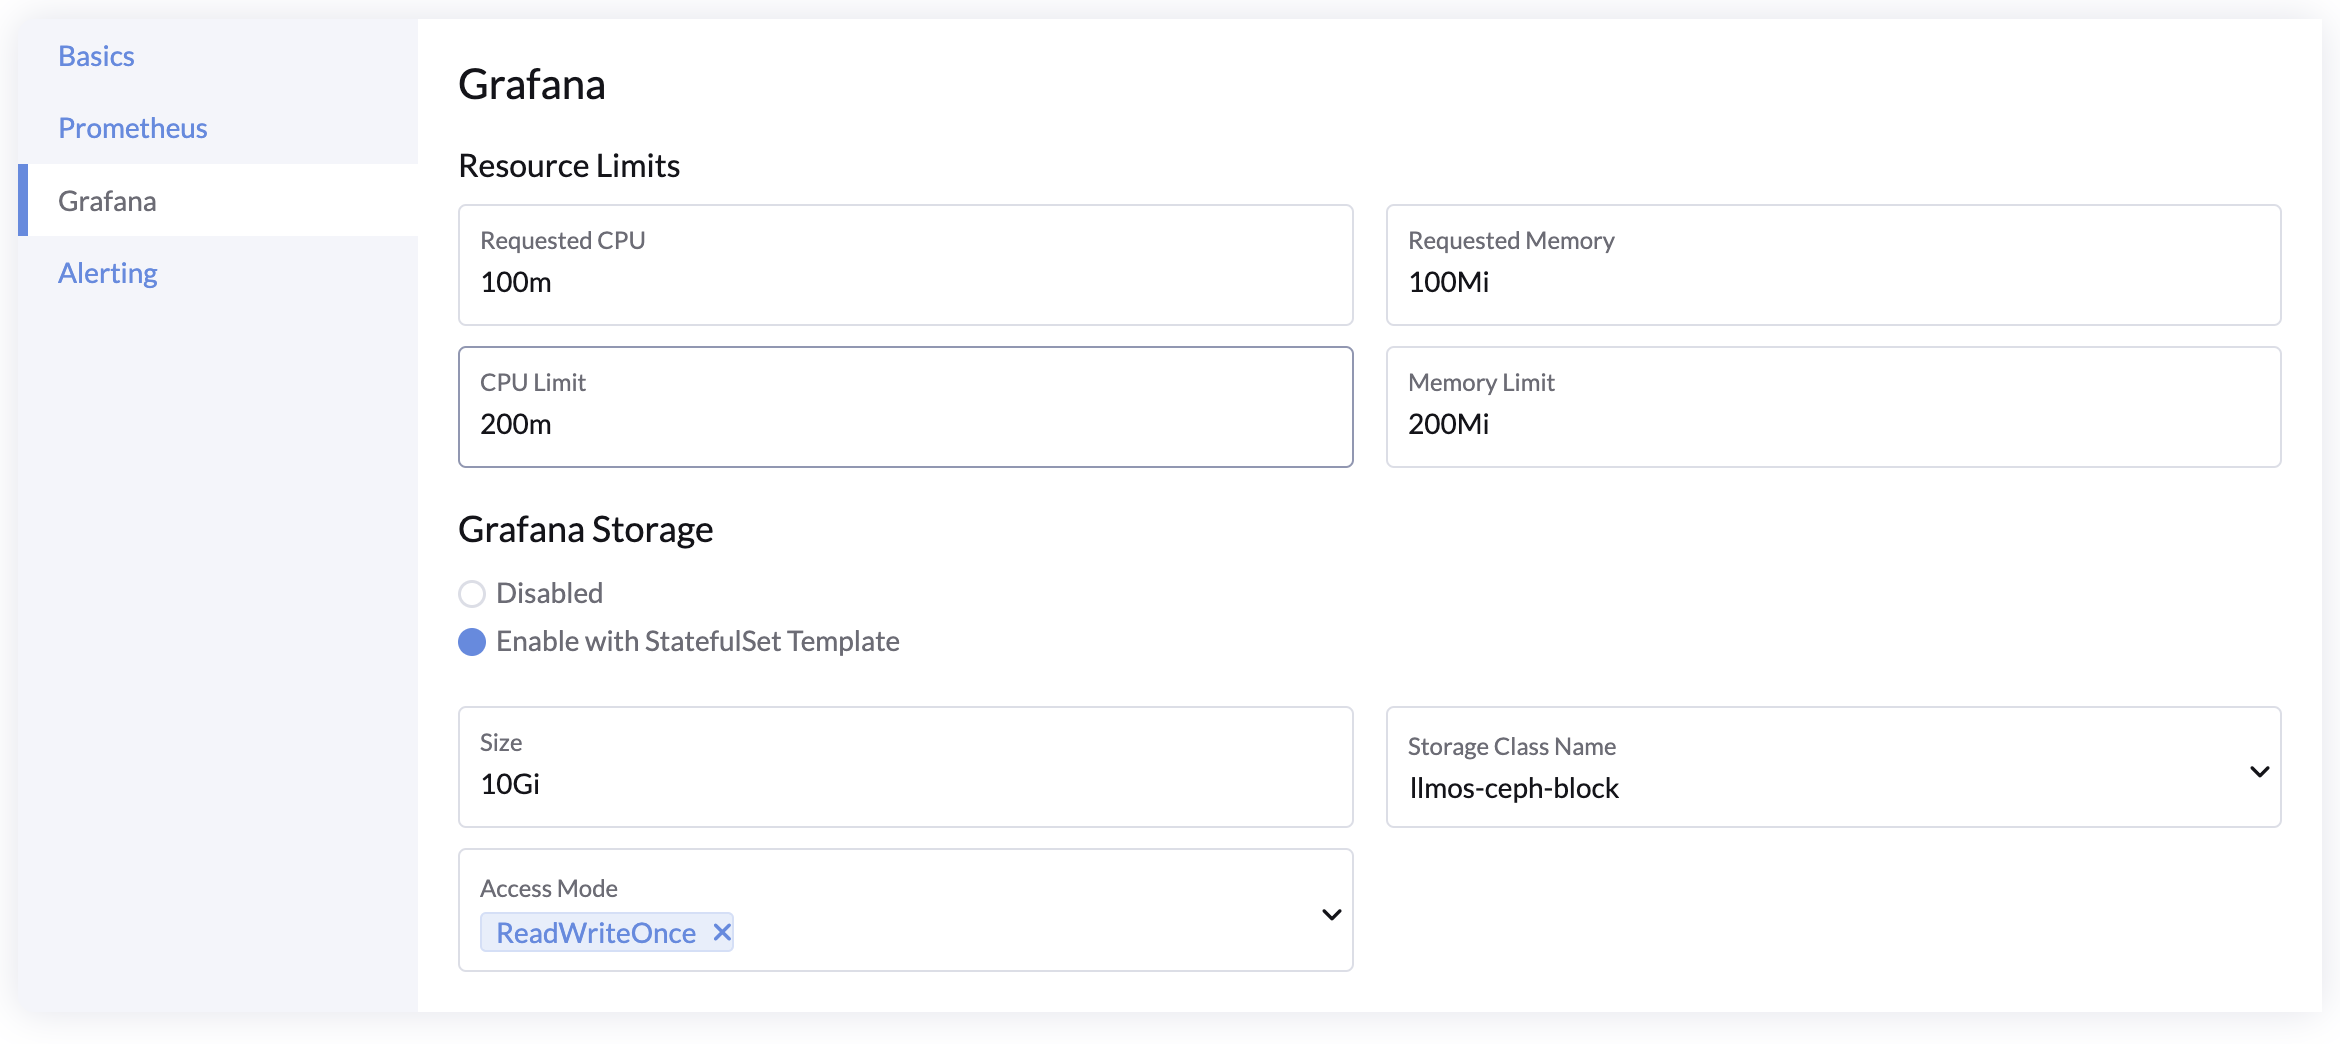
Grafana Settings
- Resources: Set resource requests and limits for Grafana pods.
- Persistent Storage: Configure storage to retain custom dashboards during upgrades or redeployments.
note
Default dashboards provided by LLMOS Monitoring don’t require persistent storage.
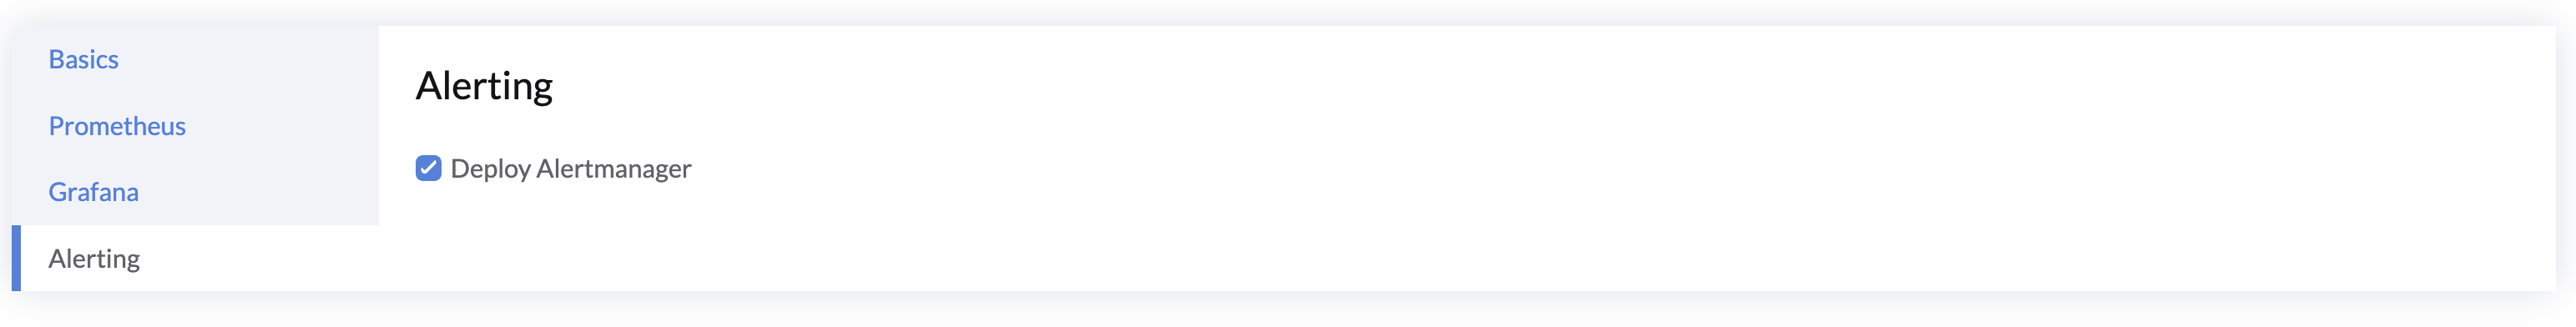
AlertManager Settings
- Enable AlertManager: Enabled by default.
Resource Limits and Requests
You can adjust resource requests and limits during installation. The table below shows the default minimum requirements:
| Component | CPU Request | Memory Request | CPU Limit | Memory Limit |
|---|---|---|---|---|
| prometheus-operator | 100m | 100Mi | 500m | 200Mi |
| prometheus | 750m | 750Mi | 1000m | 3000Mi |
| alertmanager | 100m | 100Mi | 1000m | 500Mi |
| grafana | 100m | 100Mi | 200m | 200Mi |
| kube-state-metrics | 100m | 130Mi | 200m | 200Mi |
| prometheus-node-exporter | 100m | 30Mi | 200m | 50Mi |
| Total | 1250m | 1210Mi | 3100m | 4150Mi |
Persistent Storage: Prometheus requires at least 50Gi of storage.