Monitoring Management
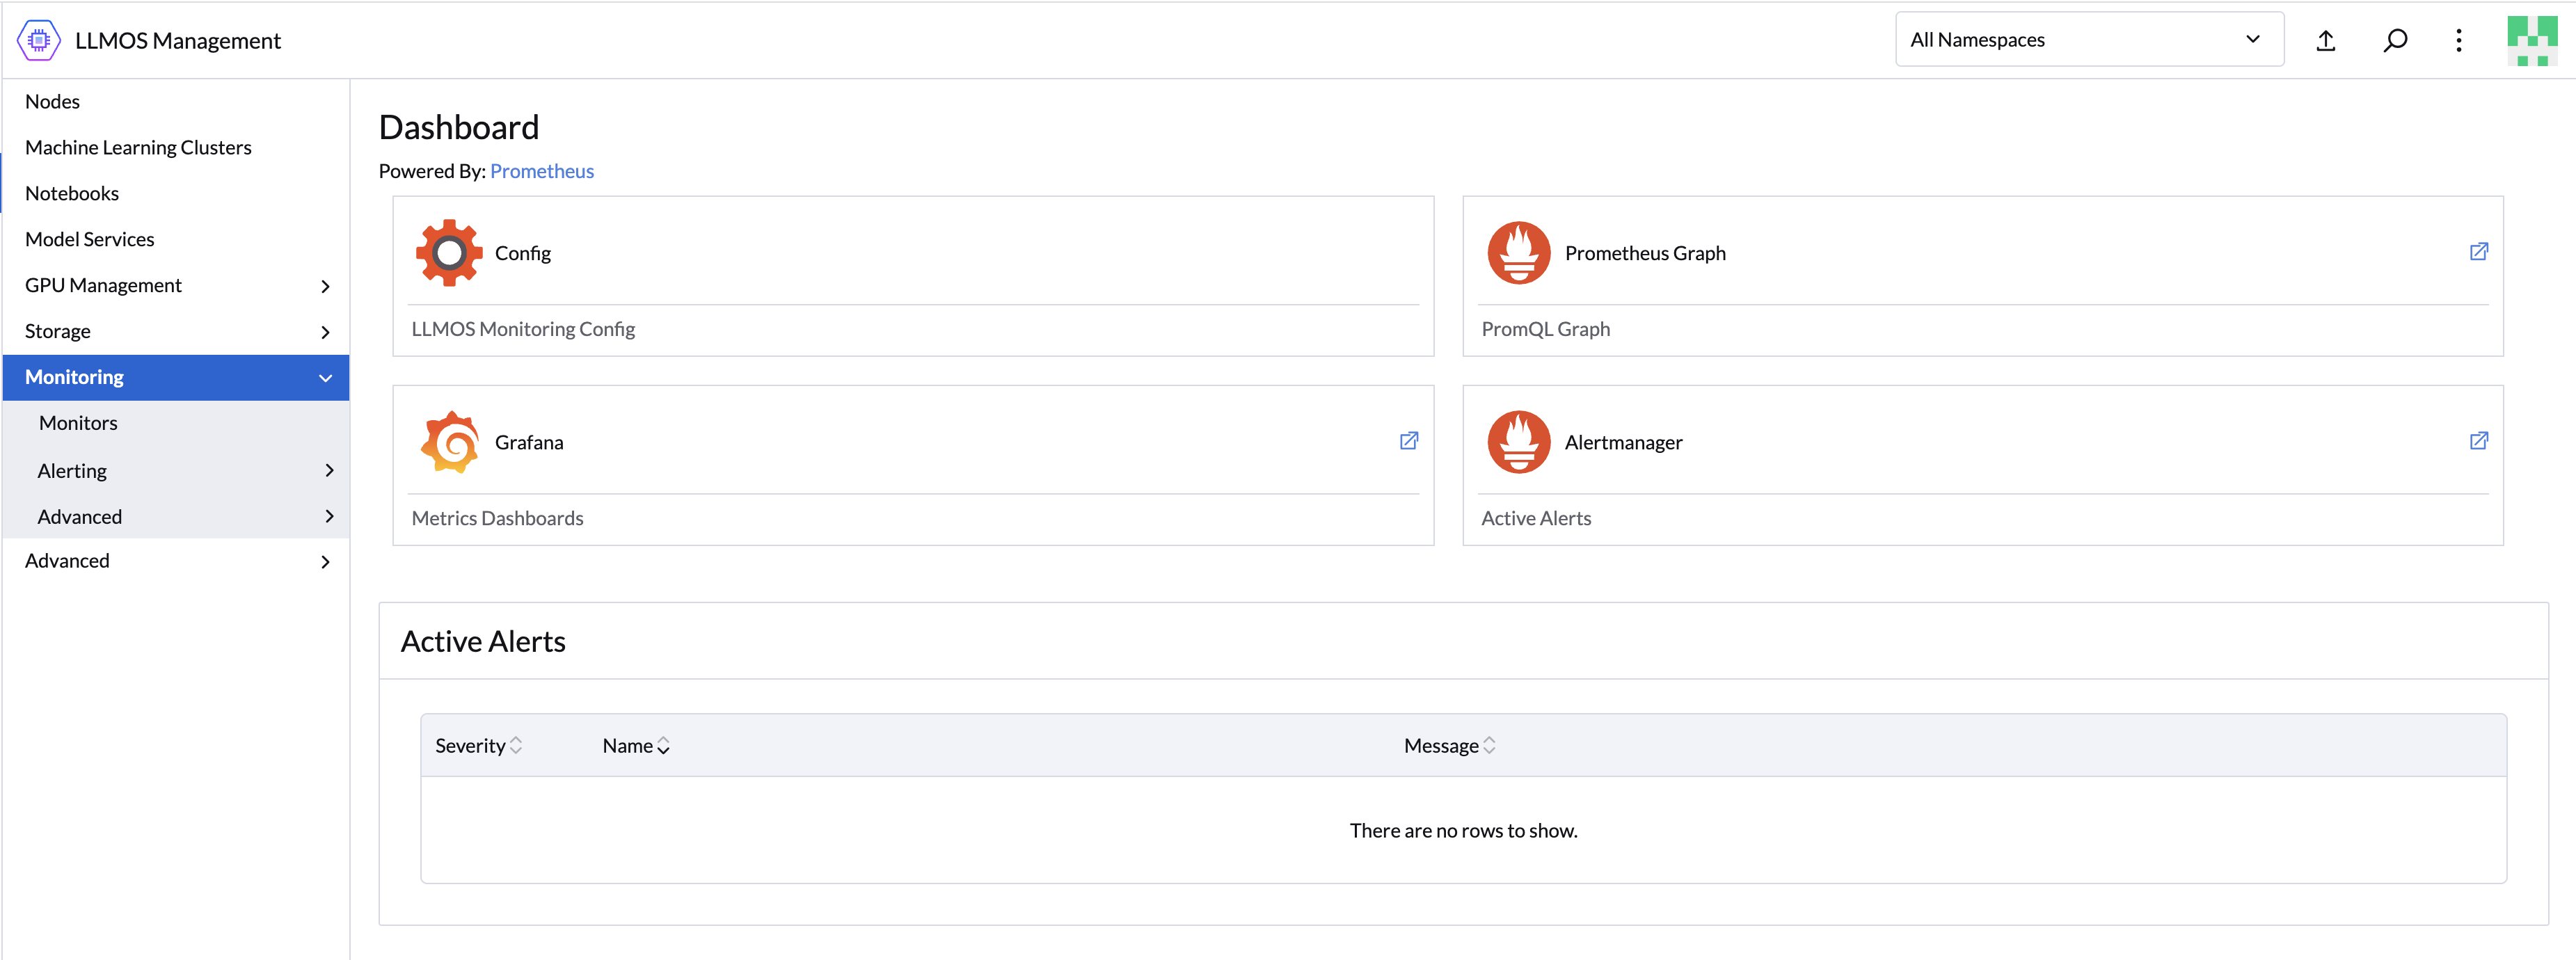
With monitoring enabled, you can manage additional prometheus rules, alerts, and access dashboards through LLMOS Management > Monitoring.
Monitoring Management
- Config: View and update LLMOS monitoring settings.
- Prometheus Graph: Access Prometheus metrics and graphs.
- Grafana: Explore Grafana dashboards.
- Alertmanager: Explore and manage alert configurations.
ServiceMonitor and PodMonitor
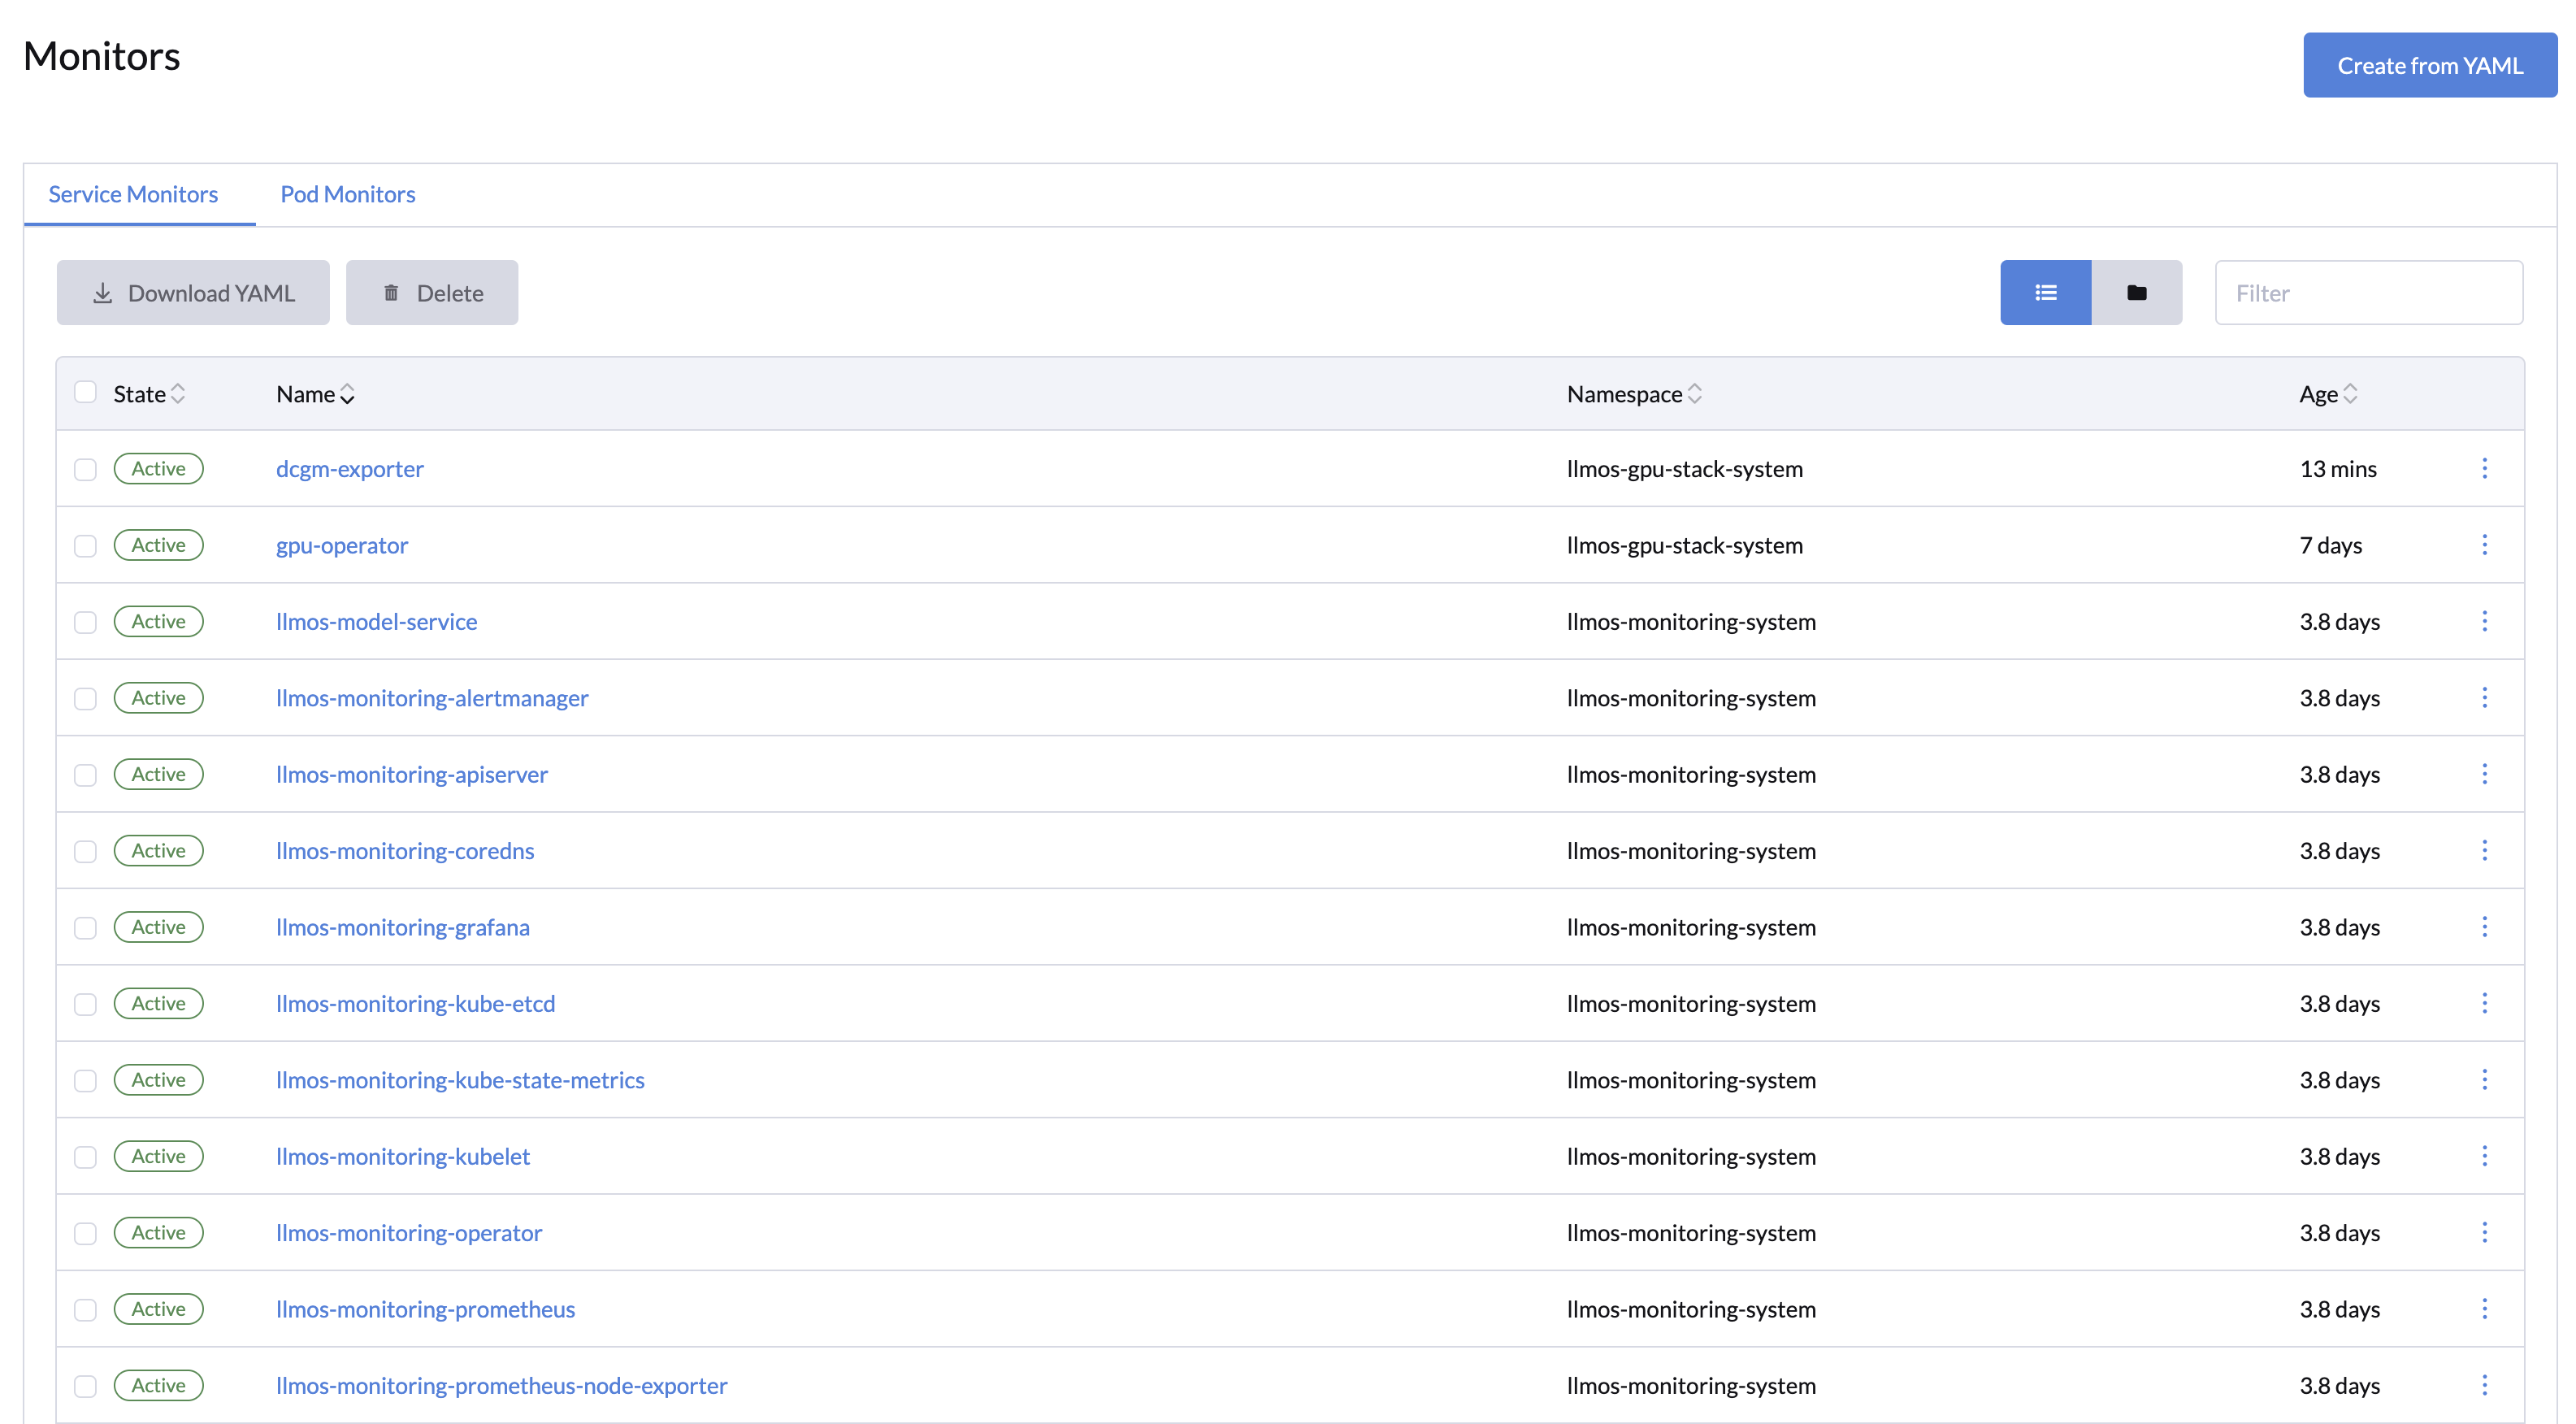
ServiceMonitors and PodMonitors are the custom resources created by the Prometheus Operator to define how Prometheus collects metrics from endpoints. These configurations ensure Prometheus knows what to scrape.
- ServiceMonitors: Best for most use cases; commonly used for scraping service endpoint metrics.
- PodMonitors: Used for specific pod-level scraping needs.
For more details:
PrometheusRules
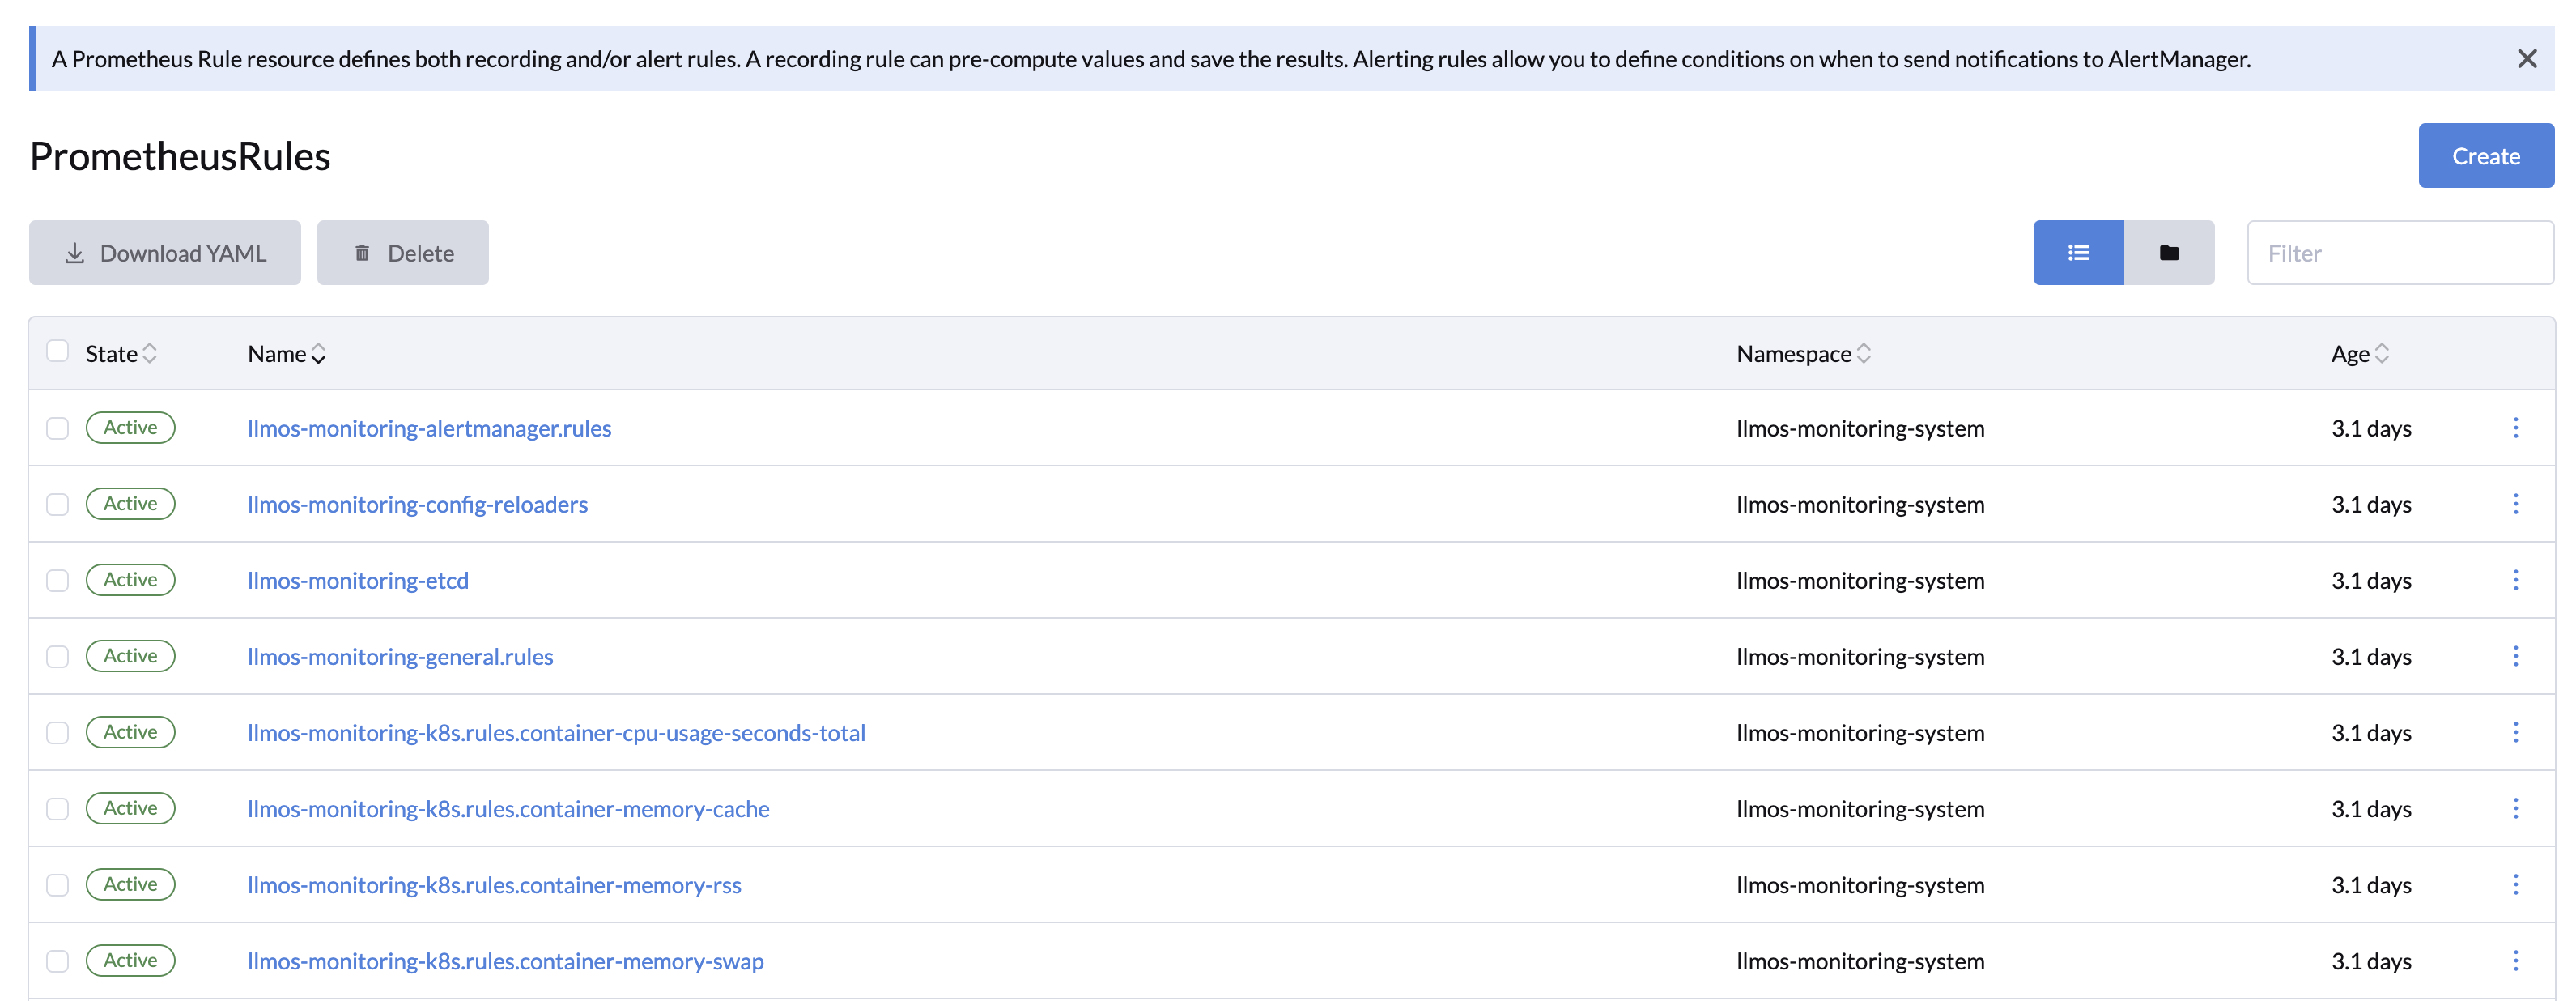
PrometheusRules let you define rules for generating alerts or precomputing metrics. These rules are evaluated at regular intervals.
- Recording Rules: Create new metrics by combining or transforming existing ones. Useful for precomputing complex queries.
- Alerting Rules: Run queries to check for specific conditions. If a query returns a non-zero value, an alert is triggered.
For more examples, check the Prometheus Rules documentation.
Alertmanager Configurations
The Alertmanager processes alerts sent by Prometheus, handling tasks like:
- Deduplication: Removing duplicate alerts.
- Grouping: Organizing alerts by similar characteristics.
- Routing: Sending alerts to the right channels like email, Slack, or webhooks.
- Silencing: Temporarily disabling alerts.
- Tracking: Monitoring the status of alerts (firing or resolved).
Creating AlertmanagerConfig Resource
To set up alert receiver & routing in Alertmanager:
- Go to LLMOS Management > Monitoring > AlertmanagerConfigs.
- Click Create and provide a name and namespace.
- Save the configuration.
- Open the created configuration and click Add Receiver:
- Name the receiver.
- Choose a notification type (e.g., Slack, email).
- Fill in the required fields (e.g., api_url and channel for Slack).
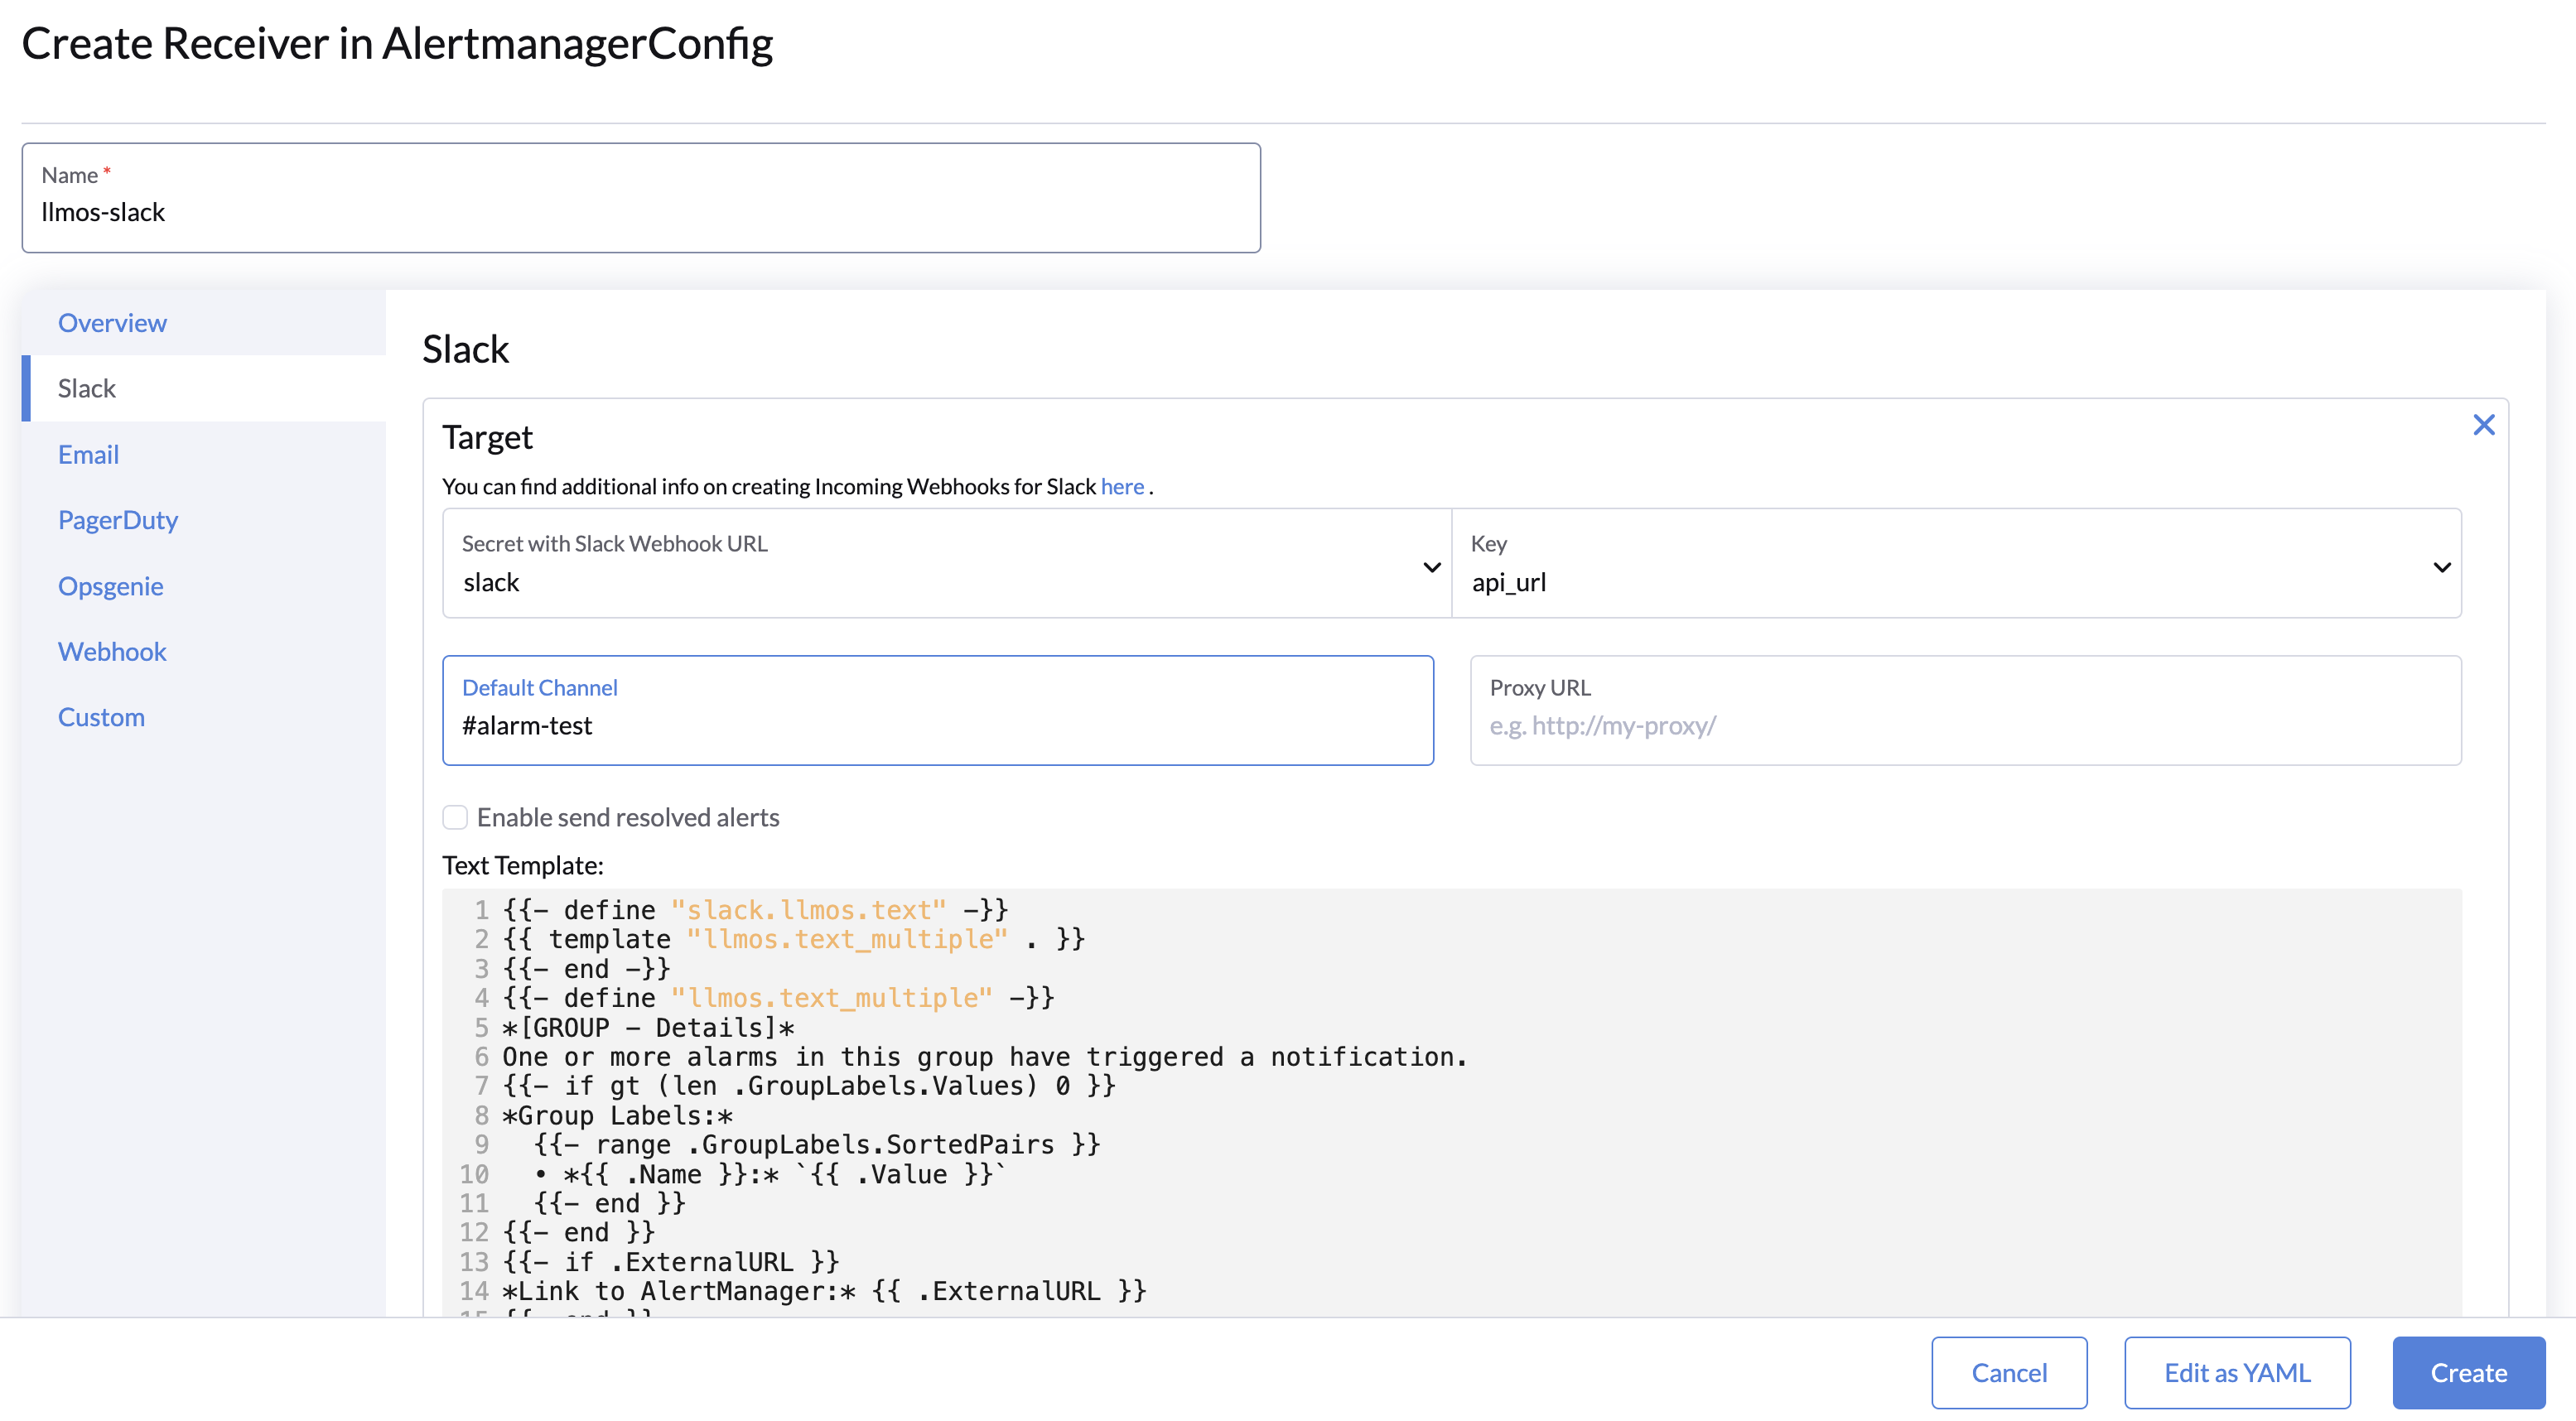
- Click on the Route tab and add a receiver and route configurations to the AlertmanagerConfig.
- Save the AlertmanagerConfig.
Result: Alerts can now be sent to your specified receivers when an alert is triggered.
For the first-level route, the Prometheus Operator automatically adds a default matcher: namepsace: <AlertmanagerConfig namespace>. This matcher ensures that alerts are routed based on the namespace of the AlertmanagerConfig.
You can handle alerts in two ways:
-
Creating an AlertmanagerConfig for Each Namespace
- This approach allows each namespace to manage its own alerts independently. Alerts will be routed to the respective namespace's configuration.
-
Using Child Routes to Handle All Alerts in a Single Place
- If you prefer centralized alert management, you can configure child routes within a single
AlertmanagerConfigthrough the YAML file. The child routes can be defined to handle alerts from multiple namespaces based on specific matchers or label conditions.
- If you prefer centralized alert management, you can configure child routes within a single
Choose the approach that best aligns with your operational and organizational needs.

Example of AlertmanagerConfig YAML
The following is an example of an AlertmanagerConfig resource using Slack:
apiVersion: monitoring.coreos.com/v1alpha1
kind: AlertmanagerConfig
metadata:
   labels:
      llmos.ai/alertmanagerconfig: "true"
   name: config-example
   namespace: llmos-monitoring-system
spec:
   receivers:
      - name: llmos-slack
        slackConfigs:
        - apiURL:
             key: api_url # custom key name
             name: $slack-secret # your secret name that contains the slack api_url
          channel: '#alarm-test'
          httpConfig: {}
          sendResolved: true
          text: |-
             {{ define "cluster" }}{{ .ExternalURL | reReplaceAll ".*alertmanager\\.(.*)" "$1" }}{{ end }}
             {{ define "slack.myorg.text" }}
             {{- $root := . -}}
             {{ range .Alerts }}
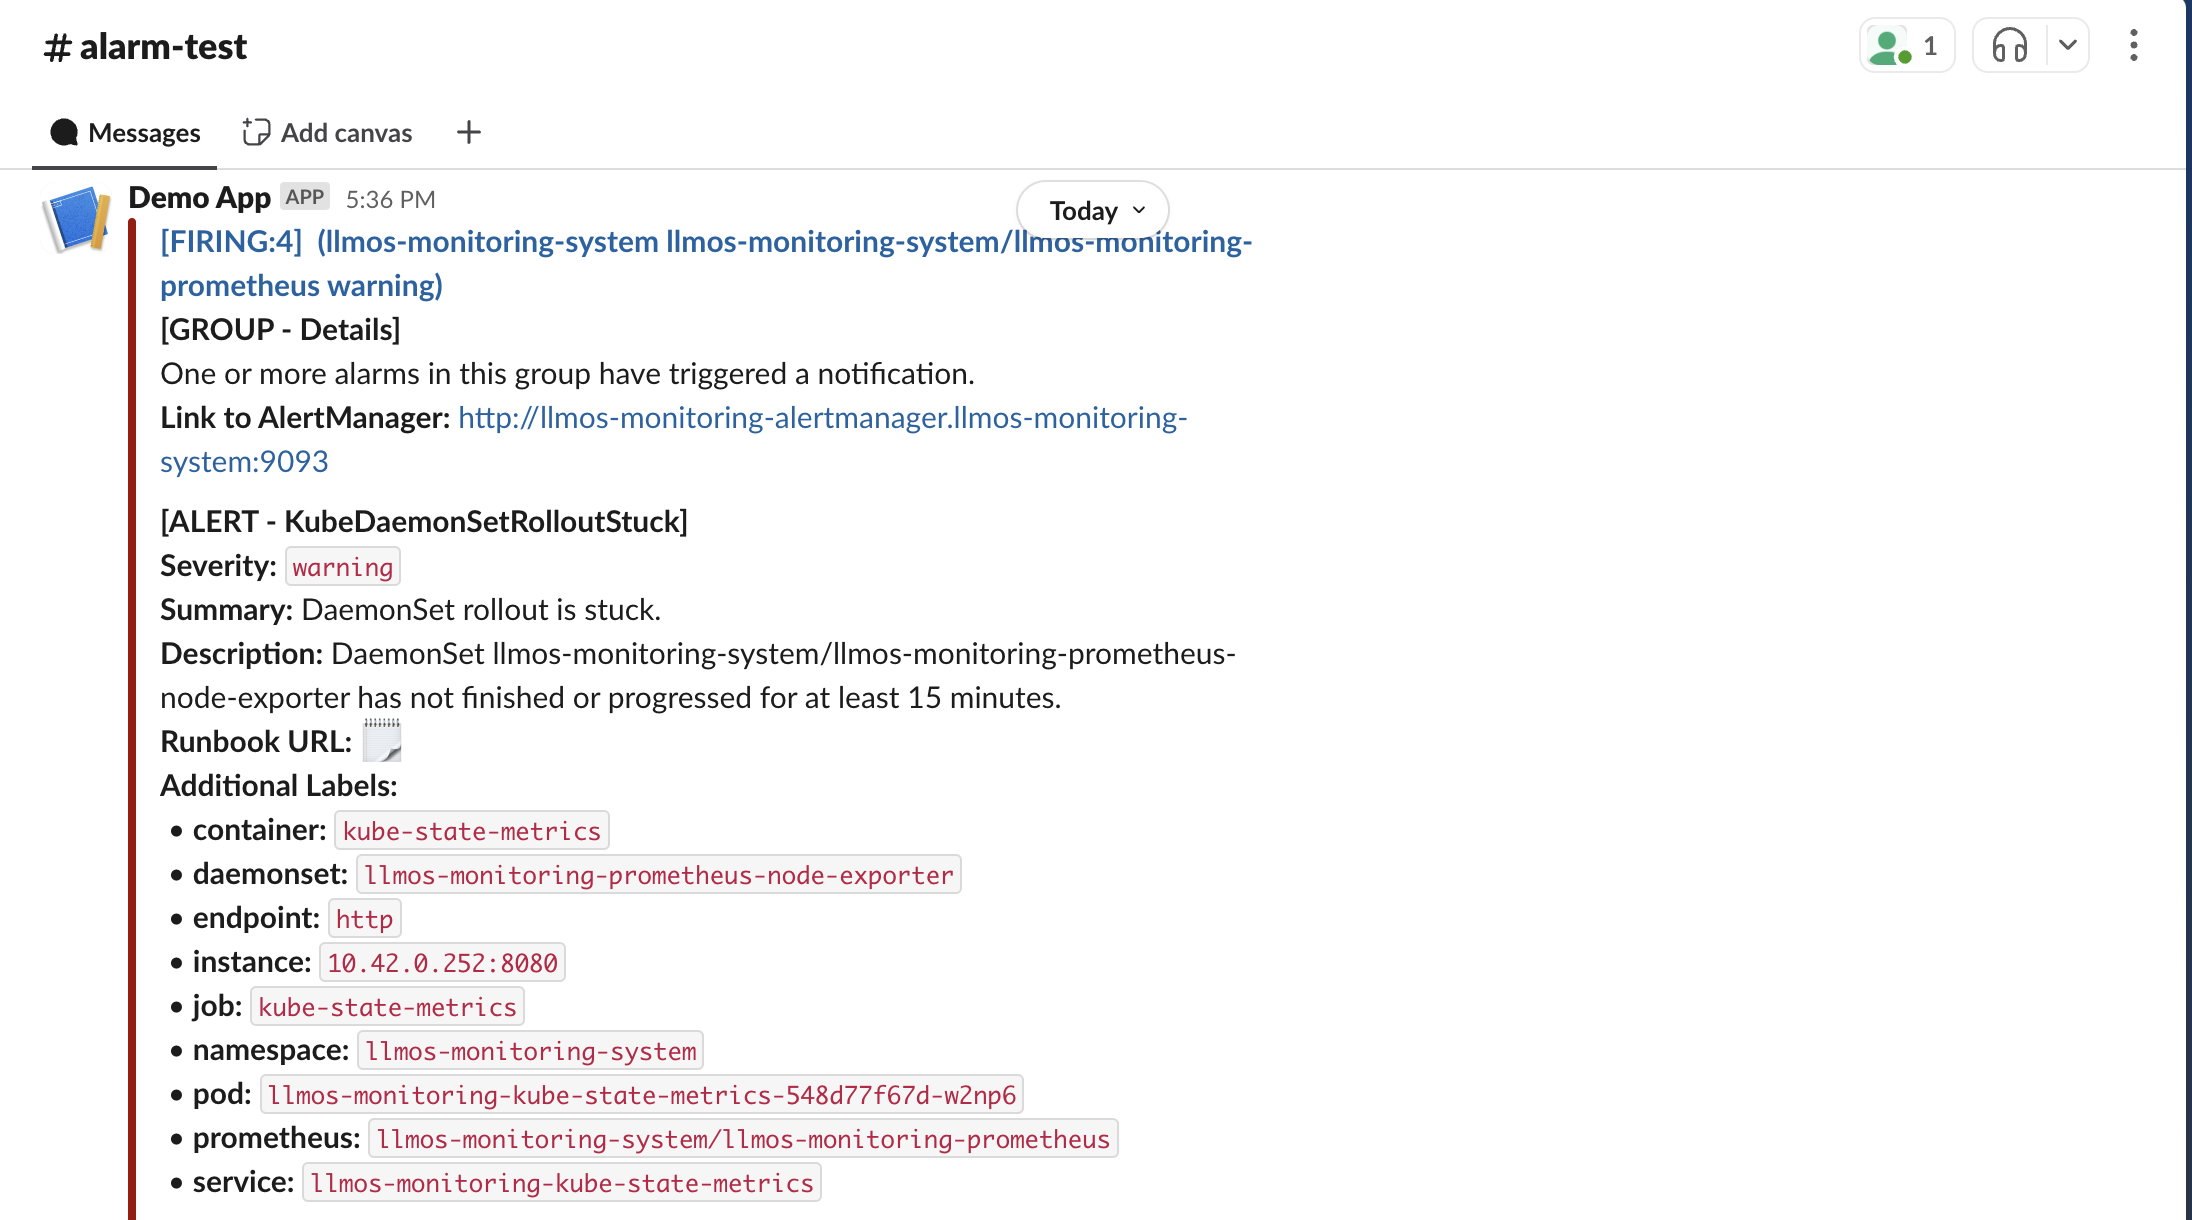
               *Alert:* {{ .Annotations.summary }} - `{{ .Labels.severity }}`
               *Cluster:* {{ template "cluster" $root }}
               *Description:* {{ .Annotations.description }}
               *Graph:* <{{ .GeneratorURL }}|:chart_with_upwards_trend:>
               *Runbook:* <{{ .Annotations.runbook_url }}|:spiral_note_pad:>
               *Details:*
                 {{ range .Labels.SortedPairs }} - *{{ .Name }}:* `{{ .Value }}`
                 {{ end }}
             {{ end }}
             {{ end }}
   route:
      groupInterval: 5m
      groupWait: 30s
      receiver: llmos-slack
      repeatInterval: 4h
Receiver Configuration
Receivers determine where notifications are sent. They can be native (e.g., Slack, email) or custom (e.g., using webhooks).
Supported Receivers in UI
- Slack: Requires a webhook URL and channel name.
- Email: Needs SMTP server details and a recipient address.
- PagerDuty: Requires an integration key.
- Opsgenie: Needs an API key and responder details.
- Webhook: Supports generic webhook URLs.
- Custom: Configure manually with YAML for unsupported systems.
For more details of each supported receiver configurations, please refer to the Prometheus Receiver Integration Settings.
Example: Slack Receiver
| Field | Description |
|---|---|
| Webhook URL | Secret with Slack webhook URL (instructions) |
| Default Channel | Channel name (e.g., #alerts). |
| Proxy URL | Proxy for the webhook notifications. |
| Send Resolved Alerts | Enable to notify when an alert is resolved. |
| Text Template | A string which is template-expanded before usage. |
Route Configuration
Routes define how alerts are processed and forwarded to their respective receivers. They specify grouping, waiting intervals, and label-based matching for alert routing.
Receiver
Each route must reference a pre-configured receiver. Ensure the receiver is set up before defining a route.

Grouping
Grouping determines how alerts are batched before sending them to receivers.
| Field | Default | Description |
|---|---|---|
| Group By | N/A | List of labels used for grouping alerts. Labels must be unique. Special label "..." aggregates by all possible labels, but it must be the only element in the list. |
| Group Wait | 30s | The time to buffer alerts of the same group before sending the first notification. |
| Group Interval | 5m | The time to wait before sending additional alerts added to an existing group after the initial notification has been sent. |
| Repeat Interval | 4h | The time to wait before re-sending a notification for an alert that has already been sent. |

For more details, see the Alerting Routes from the Prometheus Operator documentation.
Matching
Routes can filter alerts using label matchers or regex matchers.
Match
Use the Match field to define key-value pairs that filter alerts based on exact label matches. Example in YAML:
match:
  [ <labelname>: <labelvalue>, ... ]
Match Regex
Use the Match Regex field for regex-based filtering. Example in YAML:
match_re:
  [ <labelname>: <regex>, ... ]
In the route UI, adding key-value pairs to the Match or Match Regex fields will automatically generate the corresponding YAML.

Validating Alerting
After enabling the above Alertmanager configuration, you can validate it by creating a PrometheusRule object as described below.
Ensure the object's labels match the spec.ruleSelector of the Prometheus object (LLMOS Monitoring uses the release: llmos-monitoring label).
kubectl apply -f - <<EOF
apiVersion: monitoring.coreos.com/v1
kind: PrometheusRule
metadata:
  name: prometheus-example-rules
  namespace: llmos-monitoring-system
  labels:
    release: llmos-monitoring
    role: alert-rules-testing
spec:
  groups:
  - name: ./example.rules
    rules:
    - alert: ExampleAlert
      expr: vector(1)
      labels:
        namespace: llmos-monitoring-system # namespace should matches the namespace of the AlertmanagerConfig object
EOF
For demonstration purposes, the PrometheusRule object always fires the ExampleAlert alert. To validate that everything is working properly:
- Go to LLMOS Management > Monitoring, open the Prometheus web interface and navigate to the Alerts page to verify the
ExampleAlertalert is firing. - Open the Alertmanager web interface to confirm it shows one active alert.
- Verify that your configured receiver has received the alert.
Below is an example of a Slack alert notification:
